Are Tech Book Sales a Leading Economic Indicator?
November 16, 2001
This article compares sales trends of some of O'Reilly & Associates' technical books with other economic indicators, including the NASDAQ index. The author writes that the correlation between tech book sales and other economic indicators suggests that the sales may be one type of leading economic indicator.
The Holy Grail of those working in marketing, strategic, or financial departments of corporate America is to predict the future. If you happen to be in the numbers game, then you watch, collect, and plot as much data as you can get your hands on, hoping that in some of this data there is a hidden pattern that divines the future. These numbers might include billings, purchase orders, inventory, and customer sales, plotted weekly, monthly and annually. In addition to the above, it is always instructive to plot this data against as many economic indicators as possible to see how your business is doing against the general economy. And if by chance the pattern of your data matches some of the well-established leading economic indicators, whose historic behavior is well documented, then you just may have that crystal ball you are searching for.
O'Reilly & Associates is in the technical information business. We publish books, host conferences, and publish articles on emerging technologies on the O'Reilly Network. Much of our past success has been in publishing books on highly technical topics such as Unix system administration, Java and Perl programming, and more recently, peer-to-peer networking and the emerging field of bioinformatics. Our customers for these books are programmers and system administrators who are in the technical trenches. They typically find our books in bookstores across the country and through online vendors such as Amazon.com, Fatbrain, and B&N.com. It should come as no surprise that our three largest domestic retail accounts are the big retailers, Borders, Barnes and Noble, and Amazon.com.
Of particular interest are the sales trends of our technical books at some of these retail accounts. Specifically, when the sales data are plotted against a select group of economic indicators published by various government agencies, some surprising patterns emerge. The goal of this article is to expose some of these patterns, offer possible suggestions as to the cause, and propose that the data might warrant a closer look.
|
Predicting Earthquakes I am not an economist, so I am not in a position to make economic forecasts. I do, however, have a background in quantitative observation and in comparing seemingly disparate sets of data in interesting and sometimes surprising ways. Before coming to O'Reilly, I worked as seismologist with a team that gathered seismic data in California. The data was plotted and analyzed in an attempt to glean patterns that might provide clues towards predicting future behavior. However, earthquake data wasn't the only information our research group gathered. We also gathered data on radon levels in water wells, magnetic field fluctuations, the tilt of the earth's surface in and around fault systems, the behavior of domestic animals, specifically cats and dogs, before and after earthquakes, and the behavior of migratory birds. All of this data was plotted against time, and analyzed for correlations and suggestive patterns. Despite the seemingly disparate nature of the data, there were surprising correlations that have been useful in earthquake prediction. -- M.S. |
Business Cycles and Economic Indicators
Before diving into the data, a little background discussion is in order. Recalling some of the early lessons learned in a macroeconomics class, businesses and the economy follow what is aptly termed "The Business Cycle." The Business Cycle has five phases:
- The business cycle peak
- The trough
- The recovery
- The expansion
- Back to a new peak
In plotting the performance of any company over a long enough time period, these cycles can be identified time and again. Tracking an economic indicator that correctly identifies or better yet, predicts, the inflection points of the peaks and the troughs is the Holy Grail that we are seeking and attempting to identify and quantify.
Leading economic indicators are ones that have successfully and repeatedly predicted past economic downturns and recoveries. These indictors are evaluated for their economic significance, conformity to the business cycle, availability, smoothness, cyclical timing, revision cycle, and statistical adequacy. The U.S. Department of Commerce computes and maintains an index of Leading Economic Indicators. The components of the index come from the following groups of cyclical indicators:
- Employment
- Sales, orders, and deliveries
- Prices
- Fixed capital investment
- Personal income
- Money supply and stock prices
One of the easiest economic indicators to watch is no further than the business section in your morning newspaper: the stock market. The stock market is a very sensitive indicator of business peaks and troughs, because stock prices reflect both the historical performance and future expectations of a company's performance three to six months hence. According to the Federal Reserve Board, the stock market is one measure of the current value of the nation's stock of capital and is often viewed as a barometer of business and consumer confidence regarding the future. A high or rising stock market may signal robust growth of business investment and consumer spending in the near future, while a low or falling stock market may signal sluggish spending. Standard and Poor's Index of 500 companies (the S&P 500) is one of the series of indicators used to compute the U.S. government's "Index of Leading Economic Indicators."
As economists astutely point out, the stock market is not a perfect leading indicator. That being said, they also point out that an economic downturn has always been preceded by a stock market decline.1 And, taking a historical look, on average, changes in the stock market precede changes in the general economy by about six months. According to economist and business cycle expert Geoffrey H. Moore (not to be confused with Geoffrey A. Moore of Crossing the Chasm fame), as a business expansion cycle begins to slow down, production costs rise and profits fall. At the same time, there is an increased demand for capital to cover shortages in cash flow or rising expenses due to rising inflation caused by the business cycle expansion. According to Moore, the increased demand on capital causes interest rates to rise. Rising interest rates exert a negative pressure on profits and stock prices drop even as the business activity continues to expand.2
O'Reilly Book Sales Vs. the NASDAQ and Other Interesting Observations
In this study, I selected the NASDAQ as the bellwether stock index. In other recessions that were brought on by a weakening in other segments of the economy, such as manufacturing, the S&P 500 was an excellent bellwether of the resulting economic downturn. Our current economic downturn has been led by the collapse of the dot coms, the softening of demand for computer equipment, and the financial bloodbath in the telecommunications sector. The tech-heavy NASDAQ, therefore, has been an excellent leading indicator of the current economic downturn.
So what does all this have to do with predicting the future using O'Reilly's technical book sales at Amazon.com? Figure 1 is a graph of O'Reilly book sales at Amazon plotted against the NASDAQ from January 1999 through September 30, 2001. Note the similarity between the sales curve of O'Reilly books at Amazon.com and the NASDAQ over time on a macro level and, upon closer inspection, a micro level.
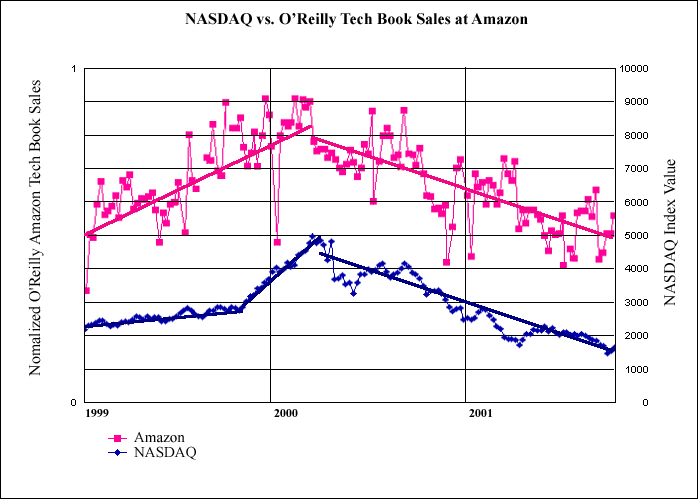 |
Figure 1. O'Reilly Tech Books at Amazon mapped against the NASDAQ Stock Index. (Click for larger image) |
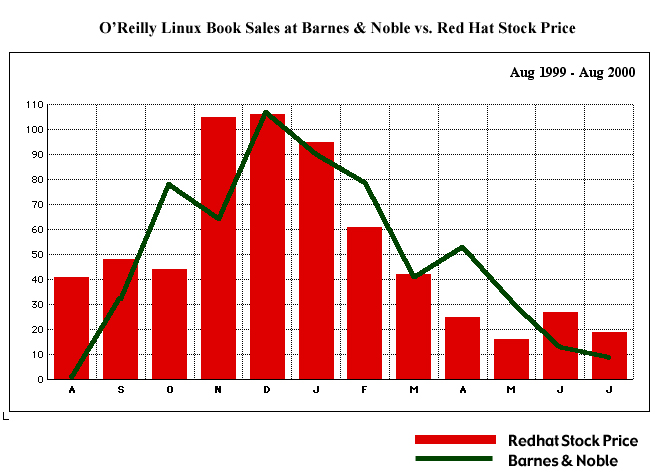 |
Figure 2: The correlation of Sales of O'Reilly Linux Titles at Barnes and Noble with Red Hat Stock Price. (Click for larger image) |
Similarly, over the same time period, we saw correlations between Oracle stock price and the sales of Oracle Books at Barnes and Noble (Figure 3).
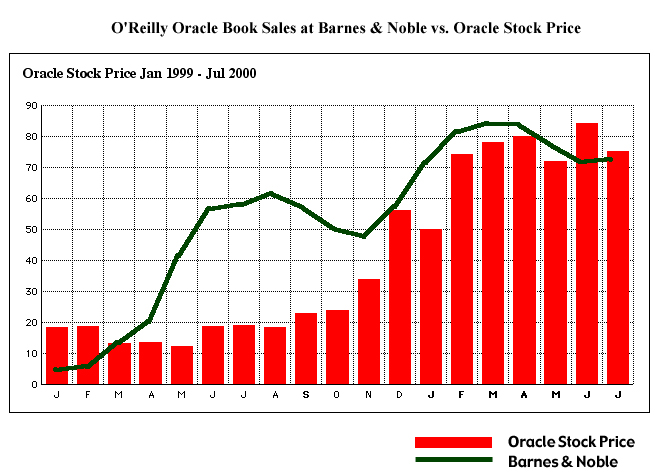 |
Figure 3. The correlation of the sale of Oracle titles at Barnes and Noble to Oracle stock price is not as strong as the correlation seen in Figure 2, but the overall trend is in the right direction. (Click for larger image) |
The most striking correlation was the sale of Linux books with the price of Red Hat Stock. We think the sale of O'Reilly's Linux books was strongly affected by the David-and-Goliath tale that the press was telling about Red Hat and Microsoft, as well as the IPO frenzy surrounding Red Hat and VA Linux. If we compare the top 10 Linux titles just prior to the IPO with the top 10 titles a year later (Table 1), we find that the earlier list is heavily weighted towards introductory Linux titles and that the later list contains more technical titles. Prior to the Red Hat IPO, consumers and investors, afraid of being left in the dust, were snatching up Linux books in the hope that these books would explain Linux and offer insight on whether to invest in Linux companies. The Linux books available on the market at the time certainly answered the first question. The answer to the second question was left to the judgment of the savvy investor.
Table 1: Top Ten Linux Titles in November 1999 and November 2000. The 1999 list contains more introductory titles than the 2000 list.
Top Linux Books - November 1999
- Running Linux
- Linux in a Nutshell
- Sams' Teach Yourself Linux in 24 Hours
- Linux Complete
- Linux For Dummies
- Red Hat Linux 6 Unleashed
- Beginning Linux Programming, 2nd Edition
- LINUX Installation, Configuration, and Use
- Linux Unleashed (Unleashed Series)
- Complete Idiot's Guide to Linux
Top Linux Books - November 2000
- Building Linux Clusters
- Running Linux
- Linux in a Nutshell
- Maximum Linux Security
- Linux Firewalls
- Red Hat Linux 6 Unleashed
- Linux Administration
- Linux Device Drivers
- Linux Network Servers: 24 by 7
- Understanding the Linux Kernel
Observations of the Behavior of Select Economic Indicators
While the NASDAQ provided an obvious set of data to use to compare with our book sales, it's instructive to compare both the NASDAQ and our book sales to other available economic indicators.
Several agencies in the U.S.government, such as the U.S. Department of Commerce, Census Bureau, Department of Labor, Bureau of Statistics, Board of Governors, and Federal Reserve System, gather and compile data used to compute economic indices. Financial markets, economists, market analysts, and the like use these indices to make judgments on the strength of the economy and, in turn, base many of their decisions on their respective "positions" using the data and their interpretations.
In surveying the landscape of available economic indicators, I selected several that would be strongly impacted by the technology sector of the economy. When these indicators are plotted against the NASDAQ and O'Reilly book sales at Amazon.com, they provide an interesting picture. Some of the indices are part of the components of the Index of Leading Economic Indicators. The components of the Leading Economic Indicator Index selected for the purposes of this article are Unemployment of the Civilian Labor Force, Average Weekly Hours Worked, and Manufacturer's New Orders. The other indices I selected are the Consumer Confidence Index (CCI), Semiconductor Billings, and the Help Wanted Index (HWI).3
Figures 4, 5, and 6 graph these indices from January 1999 through August/September 2001.
 |
Figure 4: Semiconductor Billings and the Consumer Confidence Index
(CCI) both began their downward trend in September 2000, about five months behind
the
NASDAQ. (Click to enlarge) |
Consumer Confidence stayed fairly flat until September of 2000, and since then has dropped sharply through 2001.
Semiconductor Billings rose steadily until September 2000, and since then has also dropped sharply through 2001.
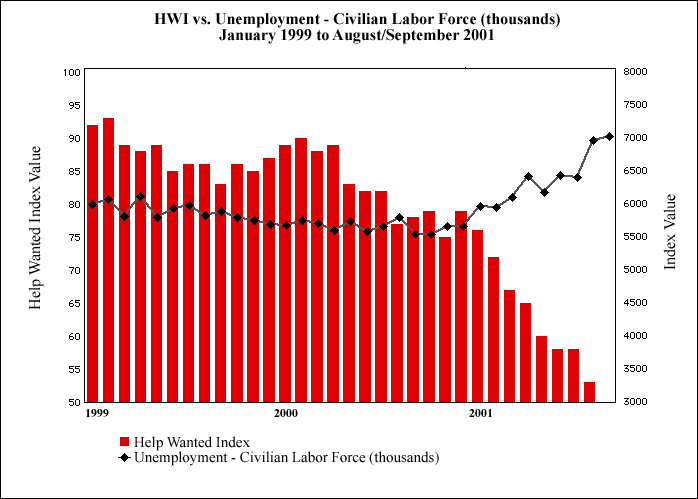 |
Figure 5: The Help Wanted Index (HWI) peaks in February of 2000,
while Unemployment begins to rise in October of 2000. We expect to see the HWI lead
Unemployment. (Click for larger image) |
The Help Wanted Index dropped very slightly from January 1999 through February 2000, and since then has dropped sharply from February 2000 through 2001 and is still continuing its downward trend.
Unemployment fell very slightly from January 1999 through October of 2000, and since then has been rising continuously through 2001.
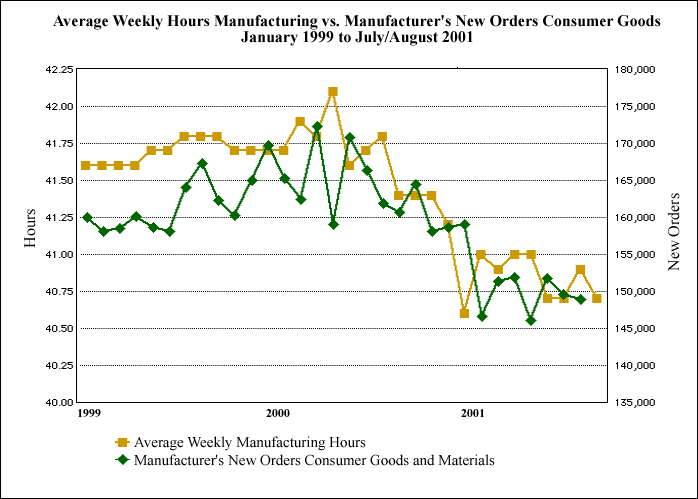 |
Figure 6: Average Weekly Hours in Manufacturing and Manufacturer's
New Orders of Consumer Goods peaked in March/April of 2000, coincident with the
NASDAQ. (Click for larger image) |
Average Weekly Manufacturing Hours peaked in April 2000, and fell to a low in December of 2000. Similarly, Manufacturer's New Orders of Consumer Goods peaked in March of 2000, and then bottomed in January of 2001. Both indexes have been teetering along a tentative bottom ever since. The broad pattern matches that of the NASDAQ, but leads the CCI and Semiconductor Billings by about four or five months.
Economic Indicators Vs. the NASDAQ and Tech Book Sales
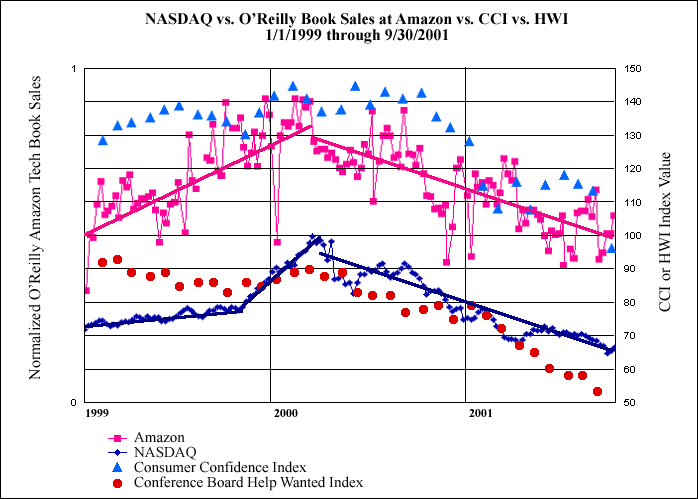 |
Figure 7: The Help Wanted Index peaked in February of 2000, coincident with the NASDAQ and O'Reilly book sales. As expected, the Consumer Confidence Index lagged behind the both NASDAQ and the Help Wanted Index. (Click for larger image) |
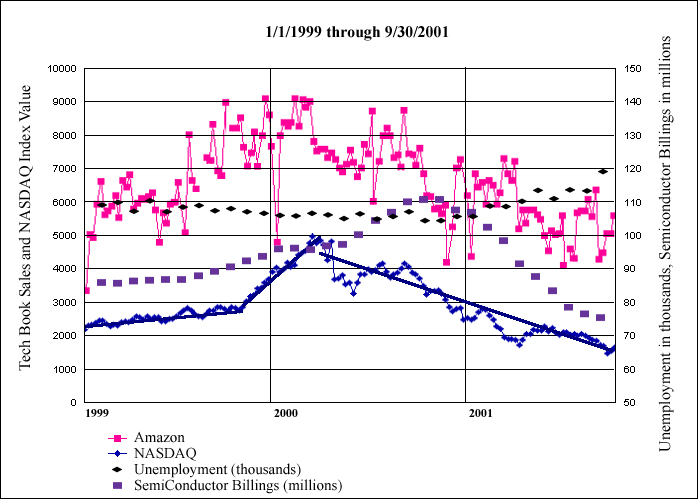 |
Figure 8: Semiconductor Billings peaked in October of 2000 while Civilian Unemployment began to rise in January of 2001. Both of these indicators lag behind the NASDAQ and O'Reilly book sales by six to nine months, respectively. (Click for larger image) |
If we accept that the NASDAQ is a leading economic indicator, then the close correlation of O'Reilly book sales at Amazon suggests that tech book sales may also be a leading economic indicator.
Another interesting observation that falls out of this study is the fact that job postings also seem to be a leading economic indicator. Although employment is one of the metrics used to compute the Leading Economic Indicator, the HWI specifically is not included. As shown above, the fall in the HWI was coincident with the fall in Average Weekly Hours Worked in Manufacturing, Manufacturer's New Orders, the NASDAQ, and O'Reilly technical book sales.
More Than Just a Coincidence
What the data suggests is that in this economic downturn, tech book sales appear to be a useful leading economic indicator (coincident with the stock market indices). The close correlation of O'Reilly's technical books sales to the NASDAQ over a two-and-a-half year period of observation certainly appears to be more than mere coincidence. We do not have access to a compendium of publisher sales data from a retail vendor such as Amazon, but a plot of all tech book sales data at Amazon versus the NASDAQ and several of the aforementioned economic indicators would certainly be interesting. The data also suggests that segmenting book sales data along economic sectors might be useful in gauging future economic downturns of other sectors of the economy.
The correlation of the data begs the question as to why tech book sales would track the NASDAQ, or in other words, what is it about consumer purchasing behavior that leads to the trends we observed? As mentioned previously, the behavior of the NASDAQ is a reflection of future earnings expectations of corporations three to six months in the future. Technical book sales closely track the need of technical people to acquire new skills at some point in the future. These purchases may reflect work in a pipeline, or new projects in the works, and are thus a gauge of future expectations.
I posed this question to Hal Varian, Dean of the School of Information Management and Systems at the University of California, Berkeley, and co-author of Information Rules: A Strategic Guide to the Network Economy. His response was, "The stock market is supposed to represent the value of the physical capital (machines) and the intangible capital (brands, reputation, patents) that a company owns. In the last boom, we saw the value of both kinds of capital in IT explode (as measured by the NASDAQ), since investors thought these companies would be very profitable. Of course, this physical capital is highly complementary to human capital in IT-related areas. Workers who had IT-related human capital (knew programming, system administration, and so on) received high wages. Hence, workers with related skills, who wanted to acquire more human capital (get higher wages), bought O'Reilly books in order to do so. So the same factor -- the belief that IT was going to be a very profitable investment -- drove investor behavior in the stock market and knowledge workers' investment in technical books."
What's the Future
If we accept the premise that tech book sales are a leading economic indicator, the data suggests that we haven't hit bottom yet but aren't falling off an economic precipice as we were earlier in the year (the events of September 11, 2001, notwithstanding). After declining sharply for nine months, the NASDAQ, manufacturing data, and O'Reilly tech book sales appear to be approaching some sort of bottom. In business cycle jargon, that would mean we are between business cycle phase number 2 (the trough) and phase number 3 (the recovery). The CCI and HWI are still falling, but if we are transitioning between phase number 2 and 3, we should see those indices begin their inflection in the next month or so. We are now in a period where the data is mixed, indicating a period of economic fragility. We will continue to watch sales at Amazon closely. A sustained period of strong sales would suggest a stronger economic outlook three to six months in the future, while a sustained period of weak sales would suggest continued weakening. The true test of whether or not all of this is mere coincidence will be if O'Reilly's tech book sales at Amazon predict a turn around.
Bibliography
1. Tainer, Evelina M., Using Economic Indicators to Improve Investment Analysis, 1993, John Wiley and Sons, New York, 270 pp., ISBN: 047158
2. Moore, Geoffrey H., Business Cycles, Inflation, and Forecasting, NBER Studies in Business Cycles, no. 24, 2nd Ed., 1983, Ballinger, Massachusetts, 499 pp., ISBN: 0884102858
3. Rogers, Mark R., Handbook of Key Economic Indicators, 1994, Irwin Professional Publishing, 298 pp., ISBN: 0786301937